Juvenile Crime Demographics
Juvenile crime demographics may help to provide an accurate picture of the felonies and misdemeanors that are committed by youth offenders.
Gender Studies
On the whole, far fewer juvenile females than males commit crimes. In 1999, females accounted for only 27 percent of juvenile arrests. In 2000, they accounted for 28 percent of juvenile arrests. Females were most involved in:
- Prostitution/commercialized vice arrests
- Embezzlement arrests
- Theft arrests
- Runaway arrests
Juvenile females were least involved in:
- Rape arrests
- Sex offense (excluding rape and prostitution) arrests
- Gambling arrests
- Robbery arrests
The arrest rate among young women did not experience the peak and fall that characterized male juvenile arrests during the 1990s. Instead, female juvenile arrest rates have steadily grown for the past 20 years.
Race Studies
Statistically, race plays a role in the types of crime in which youth become involved. The OJJDP, in its reporting, chronicles how many arrests are made in each of four racial categories – white (includes Hispanic youth), black, American-Indian, and Asian. The study charts arrest rates among different racial groups for specified juvenile crimes. It also compares arrest rates with population rates, and follows arrest rates over time. The December 2001 bulletin of the Juvenile Offenders and Victims National Report Series published the following statistics on crime in 1999:
White Youth
- White youth were arrested for 72 percent of the crime and made up 79 percent of the youth population.
- White youth were arrested in 92 percent of DUI cases.
- White youth were arrested in 16 percent of gambling cases.
- White youth were arrested for 57 percent of all juvenile violent crimes.
- White youth were arrested for 68 percent of all juvenile weapons violations.
Black Youth
- Black youth were arrested for 25 percent of the crime and made up 16 percent of the youth population.
- Black youth were arrested in 81 percent of gambling cases.
- Black youth were arrested in 5 percent of DUI cases.
- Black youth were arrested in 41 percent of all juvenile violent crimes.
- Black youth were arrested in 30 percent of all juvenile weapons violations.
American Indian Youth
- American Indian youth composed 1 percent of the juvenile population and were arrested for 1 percent of the crime.
- American Indian youth were arrested in 3 percent of liquor law violation cases.
- American Indian youth were not represented in embezzlement, gambling, or suspicion cases.
- American Indian youth were arrested in 1 percent of all juvenile violent crimes.
- American Indian youth were arrested in 1 percent of all juvenile weapons violations.
Asian Youth
- Youth of Asian descent composed 4 percent of the juvenile population and were arrested for 2 percent of the crime.
- Asian American youth were arrested in 4 percent of runaway cases.
- Asian American youth were arrested in 1 percent of drug abuse cases.
- Asian American youth were arrested in 2 percent of all juvenile violent crimes.
- Asian American youth were arrested in 2 percent of all juvenile weapons violations.
Age Studies
Juveniles are defined by the OJJDP as youth under the age of 18. In 1999, the year analyzed in the OJJDP’s National Report Series, juveniles composed 17 percent of all U.S. arrests.
Youth Under the Age of 15
- Youth under the age of 15 made up 32 percent of all juvenile arrests.
- Youth under the age of 15 were most likely to be arrested for arson, vandalism, or assault cases.
Youth Between Ages 15 and 17
- Youth between 15 and 17 made up 68 percent of all juvenile arrests.
- Youth between the ages of 15 and 17 were most likely to be arrested for alcohol and drug violation cases.
Theft, simple assault, and drug use crimes represented the highest number of arrests overall.
Usefulness of Juvenile Arrest Statistics
The statistics gathered on juvenile arrest rates inform organizations involved with youth about which juvenile crimes are prevalent within each youth subcategory (gender, race, and age). The numbers also inform policy makers on which changes have been effective, and which programs have been successful. Tracing general arrest patterns over a number of years has helped law enforcement officials, educators, and social workers direct their efforts and analyze in tangible terms the extent to which juvenile crimes are a problem. Please contact an experienced attorney to learn more.

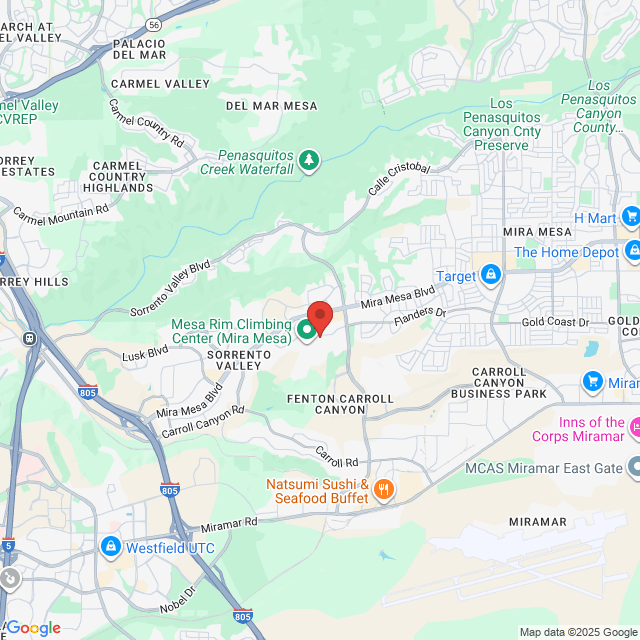
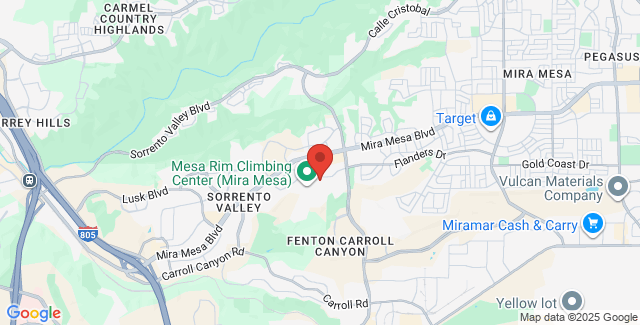
Our Location
San Diego Office
6825 Flanders Dr
Ste 160
San Diego,
CA 92121
Closed Today
Open 24 Hours A Day, 7 Days A Week